

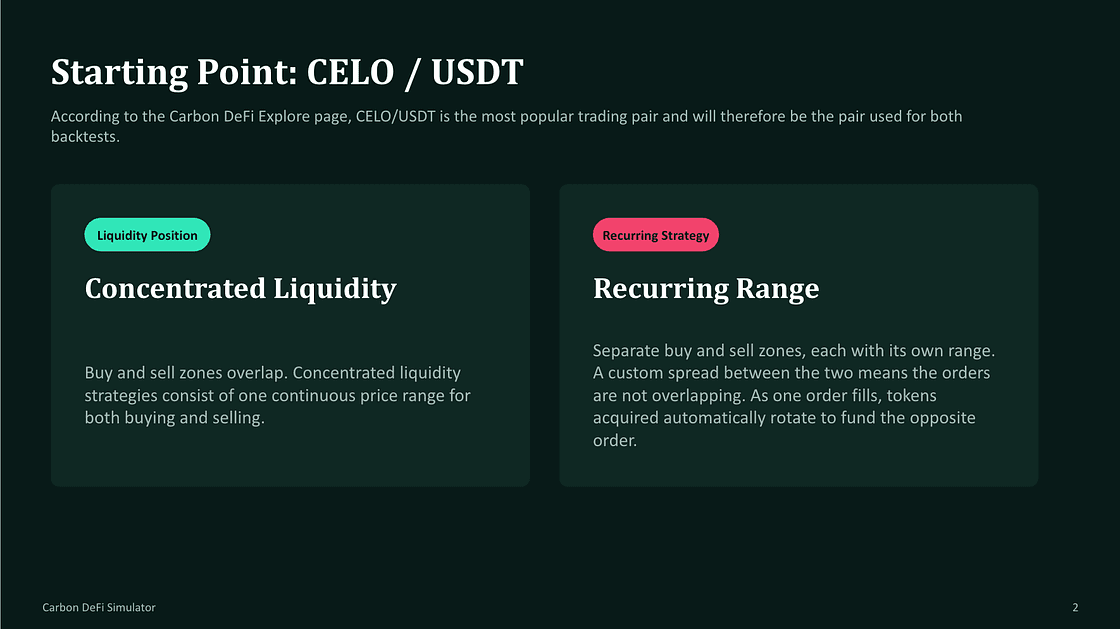
Concentrated Liquidity and a Recurring Strategy backtested using real historical data.
Two strategies trade the same CELO/USDT market from January 1 to September 19, 2026. Both start with 1,000 USDT and use the same outer price boundaries of 0.07 to 0.09 USDT per CELO.
The Concentrated Liquidity position gains 2.81 USDT, producing a 0.28% ROI versus holding.
The Recurring Strategy gains 336.08 USDT, producing a 33.61% ROI versus holding.
The pair, period, starting budget and overall price area remain the same. The difference was how each strategy was instructed to buy and sell.
The Same Starting Point
At the time of the simulations, the Carbon DeFi Explore page shows CELO/USDT as the most popular trading pair on its Celo deployment, so I decided to use it for both simulations.
Both backtests use:
Period: January 1–September 19, 2026
Starting budget: 1,000 USDT
Overall price boundaries: 0.07–0.09 USDT per CELO
Concentrated Liquidity: One Overlapping Range
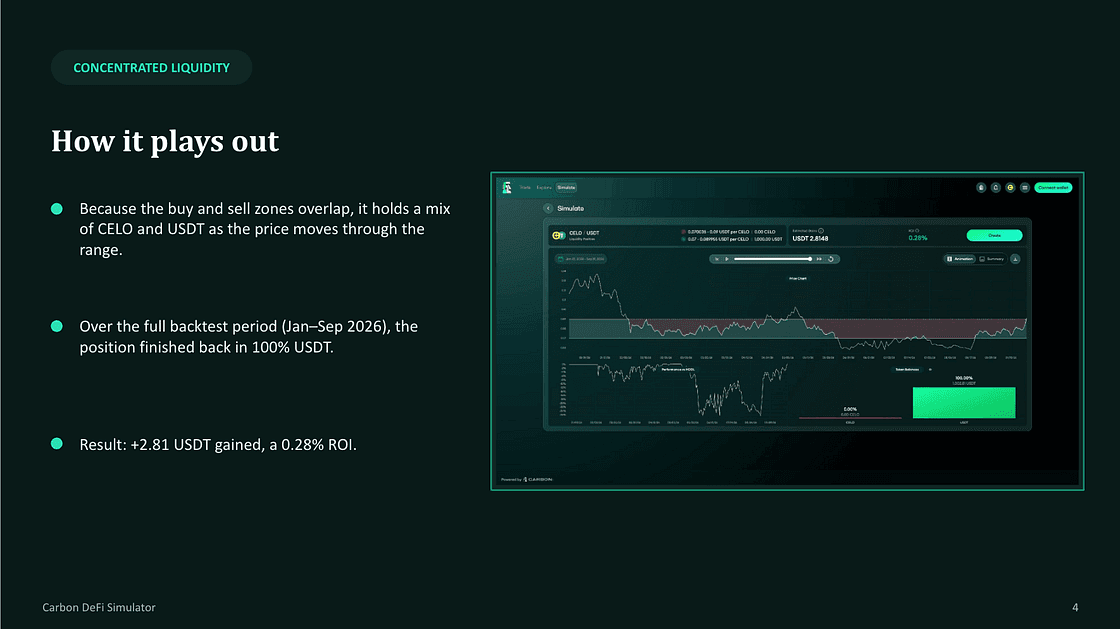
The Concentrated Liquidity position uses one continuous range from 0.07 to 0.09 USDT per CELO, with a 0.05% fee tier.
Its buy and sell zones are overlapping, occupying the same range. As the market moves through it, the position progressively converts between USDT and CELO.
Recurring Strategy: Separate Buy and Sell Ranges
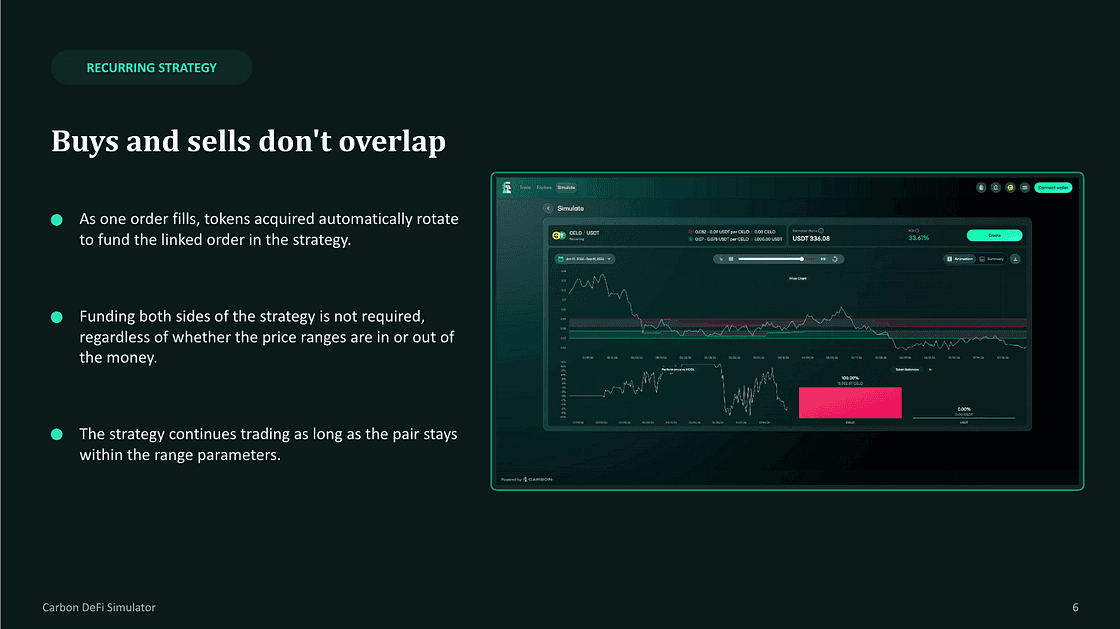
The Recurring Strategy divides the same overall price area into two independent orders:
Buy CELO: 0.07–0.078 USDT per CELO
Sell CELO: 0.082–0.09 USDT per CELO
The space between 0.078 and 0.082 creates a custom spread where neither order trades.
The strategy begins with 1,000 USDT allocated to the buy order. As that order fills, the CELO acquired automatically becomes available to fund the linked sell order. As the sell order fills, the USDT proceeds rotate back to the buy order.
This allows the strategy to repeat as the market moves between the two ranges.
The Results
For this historical period, the Carbon DeFi Simulator reports:
Concentrated Liquidity: +2.81 USDT and 0.28% ROI versus holding
Recurring Strategy: +336.08 USDT and 33.61% ROI versus holding
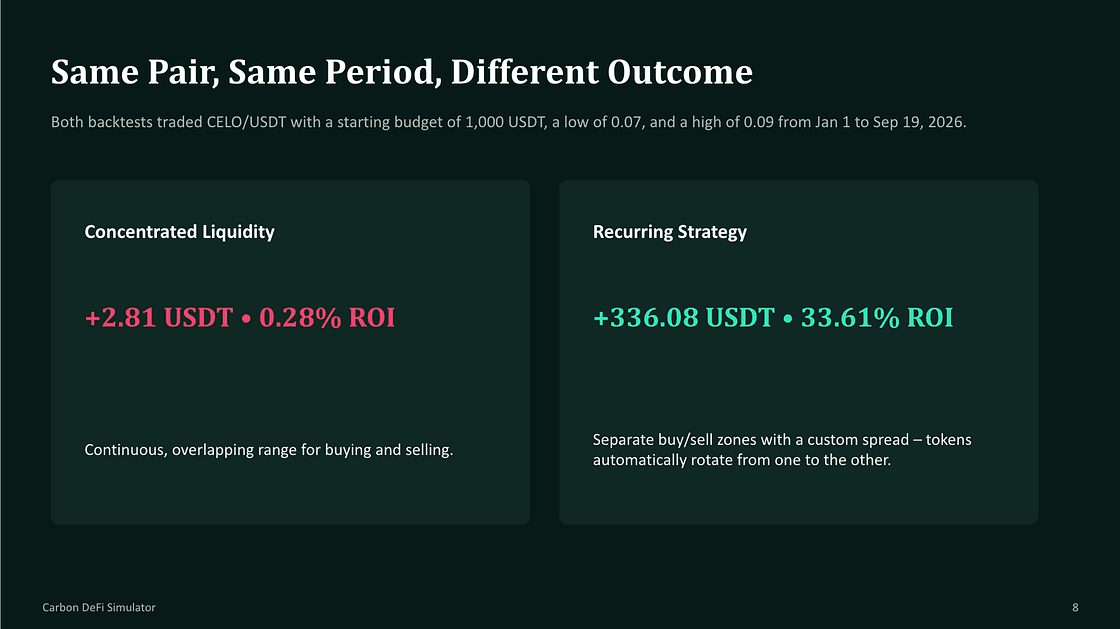
The Concentrated Liquidity position bought and sold throughout one overlapping range. The Recurring Strategy only bought inside its lower range and only sold inside its upper range, preserving a custom spread between the two actions. Although the spread was small, at 0.04 USDT per CELO, the impact was significant.
What the Backtest Shows
I expected the two strategies to behave differently. I didn’t expect the difference to be this large, especially with what I’d consider to be a modest spread.
The Carbon DeFi Simulator shows how much the structure of a strategy changes what happens to our tokens — and our earning potential — even when the pair, starting budget, time period and outer price boundaries remain the same.
Apply custom token pairs, prices, ranges, budgets and spreads to up to 365 days of historical market data. You can review every simulated trade, follow the changing token balances and compare different parameters before deploying anything onchain.
Start with the strategy you think will work. Then change the ranges. Add a spread. Compare it with another strategy type.
You may confirm what you already believe. You may find that one small adjustment completely alters the result.
In this case, it did. Separating the buy and sell ranges produced roughly 120x the ROI.


